spidx
Differences
This shows you the differences between two versions of the page.
| Both sides previous revisionPrevious revisionNext revision | Previous revision | ||
| spidx [2017/11/30 14:10] – intema | spidx [2022/07/25 13:46] (current) – fdg | ||
|---|---|---|---|
| Line 24: | Line 24: | ||
| {{ wiki: | {{ wiki: | ||
| - | The final spectral index catalogue has 1 392 563 entries, of which 502,170 (36%) are full detections (source type: S, C, or M), 843,104 (61%) are lower limits (L), and 6,383 (<1%) are upper limits (U). Entries marked as island (I) are 40,906 (3%). The high number of lower limits is due to the higher sensitivity of NVSS with respect to TGSS. | + | The final spectral index catalogue has 1 396 515 entries, of which 503,647 (36%) are full detections (source type: S, C, or M), 845,459 (61%) are lower limits (L), and 6,386 (<1%) are upper limits (U). Entries marked as island (I) are 41,023 (3%). The high number of lower limits is due to the higher sensitivity of NVSS with respect to TGSS. |
| The spectral index catalog can be downloaded here: | The spectral index catalog can be downloaded here: | ||
| Line 53: | Line 53: | ||
| ^ Isl_id | -- | Island identification number | | ^ Isl_id | -- | Island identification number | | ||
| ^ Source_id | -- | Unique source identification number | | ^ Source_id | -- | Unique source identification number | | ||
| + | Some notes are valid only for specific entry types as saved in the S_code column. | ||
| ----- | ----- | ||
| + | |||
| ===== Spectral index map ===== | ===== Spectral index map ===== | ||
| Line 62: | Line 64: | ||
| - a spectral index error map for each //good// pixel that shows the standard deviation of the bootstrapped distribution. | - a spectral index error map for each //good// pixel that shows the standard deviation of the bootstrapped distribution. | ||
| - | * Direct access through the web-based Aladin lite tool (limited functionality; | + | Direct access through the web-based Aladin lite tool (limited functionality; |
| - | * [[http:// | + | * [[http:// |
| - | *[[http:// | + | * [[http:// |
| - | * Download | + | |
| + | Alternatively, | ||
| + | |||
| + | Then use menu // | ||
| + | * [[http:// | ||
| + | * [[http:// | ||
| - | For option 2, use menu // | + | Fits files are available |
| - | | + | |
| - | * [[http:// | + | |
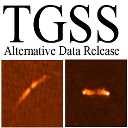
| Two examples of the radio spectral index map produced matching pixel-by-pixel the NVSS and the TGSS maps. Left is the NVSS image, right the TGSS image, at the centre we show the spectral index map: | Two examples of the radio spectral index map produced matching pixel-by-pixel the NVSS and the TGSS maps. Left is the NVSS image, right the TGSS image, at the centre we show the spectral index map: | ||
| Line 80: | Line 85: | ||
| ===== Acknowledgements ===== | ===== Acknowledgements ===== | ||
| - | If you use the resources listed in this page, please reference the paper: de Gasperin, Intema & Frail (2017; | + | If you use resources listed in this page, please reference the paper: |
| ----- | ----- | ||
| + | < | ||
| + | <!-- Start of StatCounter Code for Default Guide --> | ||
| + | <script type=" | ||
| + | var sc_project=10919825; | ||
| + | var sc_invisible=1; | ||
| + | var sc_security=" | ||
| + | var sc_text=5; | ||
| + | var scJsHost = ((" | ||
| + | " | ||
| + | document.write("< | ||
| + | scJsHost+ | ||
| + | " | ||
| + | </ | ||
| + | < | ||
| + | statistics" | ||
| + | target=" | ||
| + | src="// | ||
| + | alt=" | ||
| + | <!-- End of StatCounter Code for Default Guide --> | ||
| + | </ | ||
spidx.1512051013.txt.gz · Last modified: 2017/11/30 14:10 by intema