spidx
Differences
This shows you the differences between two versions of the page.
| Next revision | Previous revisionNext revisionBoth sides next revision | ||
| spidx [2017/05/15 08:35] – created fdg | spidx [2018/03/13 13:33] – [Acknowledgements] intema | ||
|---|---|---|---|
| Line 1: | Line 1: | ||
| - | joki0 | + | ~~NOCACHE~~ |
| + | |||
| + | {{htmlmetatags> | ||
| + | |||
| + | |||
| + | ====== TGSS-NVSS spectral index maps and catalog ====== | ||
| + | |||
| + | === Science team: Francesco de Gasperin (Leiden), Huib T. Intema (Leiden) & Dale A. Frail (NRAO) === | ||
| + | |||
| + | We produced a spectral index catalog matching specially re-processed images from two radio surveys at different frequencies: | ||
| + | |||
| + | ----- | ||
| + | ===== Catalog ===== | ||
| + | |||
| + | Sources in the catalog are classified into categories: | ||
| + | |||
| + | * **single** (S): a matched (detection in both NVSS and TGSS) source with no other detections in the same island -- these sources are simple, usually point-like or slightly extended in both surveys; | ||
| + | * **multiple** (M): a matched source with other matched sources (but no unmatched sources) in the same island -- these sources are most of the time double-lobe radio galaxies or collections of nearby point sources; | ||
| + | * **complex** (C): a matched source with unmatched detections in one of the two surveys in the same island -- these sources might be part of a more complex object, e.g. a lobe of a radio galaxy where the other lobe is too faint to be detected in one of the surveys; | ||
| + | * **upper limit** (L): a detection in NVSS with no TGSS detection in the same island -- multiple NVSS detections in the island create multiple entries in the catalogue; | ||
| + | * **lower limit** (U): a detection in TGSS with no NVSS detection in the same island -- multiple TGSS detections in the island create multiple entries in the catalogue; | ||
| + | * **island** (I): if an island is not only made by matched sources (S, M) or unmatched source of the same survey (L, U), the global values of that island are saved as a separate entry -- these sources have naturally a poor positional constrain, complex sources (C) are always also part of an island source (I). | ||
| + | |||
| + | {{ wiki: | ||
| + | |||
| + | The final spectral index catalogue has 1 396 515 entries, of which 503,647 (36%) are full detections (source type: S, C, or M), 845,459 (61%) are lower limits (L), and 6,386 (<1%) are upper limits (U). Entries marked as island (I) are 41,023 (3%). The high number of lower limits is due to the higher sensitivity of NVSS with respect to TGSS. | ||
| + | |||
| + | The spectral index catalog can be downloaded here: | ||
| + | * [[http:// | ||
| + | |||
| + | Catalog columns: | ||
| + | |||
| + | ^ Column ^ Unit ^ Notes ^ | ||
| + | ^ RA | degree | S,M,C,I: weighted average of NVSS and TGSS detections | | ||
| + | ^ DEC | degree | S,M,C,I: weighted average of NVSS and TGSS detections | | ||
| + | ^ Total_flux_NVSS | Jy | I: sum of detections fluxes; U: set to 0 | | ||
| + | ^ E_Total_flux_NVSS | Jy | I: quadratic mean of detections' | ||
| + | ^ Peak_flux_NVSS | Jy/beam | I: maximum of detections peak fluxes; U: set to 0 | | ||
| + | ^ E_Peak_flux_NVSS | Jy/beam | I: error relative to the maximum of detections peak fluxes; U: set to 0 | | ||
| + | ^ Rms_NVSS | Jy/beam | Local rms noise | | ||
| + | ^ Total_flux_TGSS | Jy | I: sum of detections fluxes; L: set to 0 | | ||
| + | ^ E_Total_flux_TGSS | Jy | I: quadratic mean of detections' | ||
| + | ^ Peak_flux_TGSS | Jy/beam | I: maximum of detections peak fluxes; L: set to 0 | | ||
| + | ^ E_Peak_flux_TGSS | Jy/beam | I: error relative to the maximum of detections peak fluxes; L: set to 0 | | ||
| + | ^ Rms_TGSS | Jy/beam | Local rms noise | | ||
| + | ^ Spidx | -- | Spectral index | | ||
| + | ^ E_Spidx | -- | L,U: set to 0 | | ||
| + | ^ s2n | -- | Peak_flux over Island Rms | | ||
| + | ^ S_code | S,M,C,L,U,I | Source code as described above | | ||
| + | ^ Num_match | -- | Number of matched sources in the same island | | ||
| + | ^ Num_unmatch_NVSS | -- | Number of NVSS unmatched sources in the same island | | ||
| + | ^ Num_unmatch_TGSS | -- | Number of TGSS unmatched sources in the same island | | ||
| + | ^ Isl_id | -- | Island identification number | | ||
| + | ^ Source_id | -- | Unique source identification number | | ||
| + | Some notes are valid only for specific entry types as saved in the S_code column. | ||
| + | |||
| + | ----- | ||
| + | |||
| + | ===== Spectral index map ===== | ||
| + | |||
| + | We produced a spectral index map that covers in total 80% of the sky (Dec>-40 deg). The map has been created by extracting a pixel by pixel spectral index value from the NVSS and TGSS images used for the spectral index catalogue. From these images, we retained only those pixels that were at least three times above the noise in both surveys. The output of the process are two maps: | ||
| + | |||
| + | - a spectral index map for all //good// pixels, each spectral index has been calculated by bootstrapping 1000 times the spectral index value and using the mean of the distribution as estimator; | ||
| + | - a spectral index error map for each //good// pixel that shows the standard deviation of the bootstrapped distribution. | ||
| + | |||
| + | * Direct access through the web-based Aladin lite tool (limited functionality; | ||
| + | * [[http:// | ||
| + | *[[http:// | ||
| + | * Download and run the [[http:// | ||
| + | |||
| + | For option 2, use menu // | ||
| + | * [[http:// | ||
| + | * [[http:// | ||
| + | |||
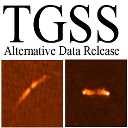
| + | Two examples of the radio spectral index map produced matching pixel-by-pixel the NVSS and the TGSS maps. Left is the NVSS image, right the TGSS image, at the centre we show the spectral index map: | ||
| + | |||
| + | {{ wiki: | ||
| + | {{ wiki: | ||
| + | |||
| + | |||
| + | ----- | ||
| + | ===== Acknowledgements ===== | ||
| + | |||
| + | If you use resources listed in this page, please reference the paper: de Gasperin, Intema & Frail, MNRAS, 474, 5008 (2018). | ||
| + | |||
| + | ----- | ||
| + | |||
| + | < | ||
| + | <!-- Start of StatCounter Code for Default Guide --> | ||
| + | <script type=" | ||
| + | var sc_project=10919825; | ||
| + | var sc_invisible=1; | ||
| + | var sc_security=" | ||
| + | var sc_text=5; | ||
| + | var scJsHost = ((" | ||
| + | " | ||
| + | document.write("< | ||
| + | scJsHost+ | ||
| + | " | ||
| + | </ | ||
| + | < | ||
| + | statistics" | ||
| + | target=" | ||
| + | src="// | ||
| + | alt=" | ||
| + | <!-- End of StatCounter Code for Default Guide --> | ||
| + | </ | ||
spidx.txt · Last modified: 2022/07/25 13:46 by fdg